
In this Part One of the 2012/2013 Vineyards-Bordeaux market analysis we will review the Bordeaux vineyard market and its price movements over the recent years. Then in Part Two of the report we will look more specifically at today’s market and try to offer our opinion regarding the likely direction of the market in the next 24 to 36 months.
The SAFER breaks down their market segments within the overall Bordeaux AOC into six geographic areas:
- Bordeaux/Bordeaux Superieur.
- Cotes de Bordeaux.
- Graves, Pessac-Léognan.
- Haut Medoc.
- St Estephe, Pauillac, St Julian-Margaux.
- St Emilion, Pomerol and Satellites
The first thing to note is that the SAFER numbers are averages. This is something we will review in more detail in Part Two, however, for now, it is important just to recognize that an average can be very misleading if you do not understand the context of the appellations that are being analysed. What this means therefore is that the price per hectare numbers that are presented in the attached graphs are not helpful unless you understand how the average prices were arrived at and how big each geographic area is.
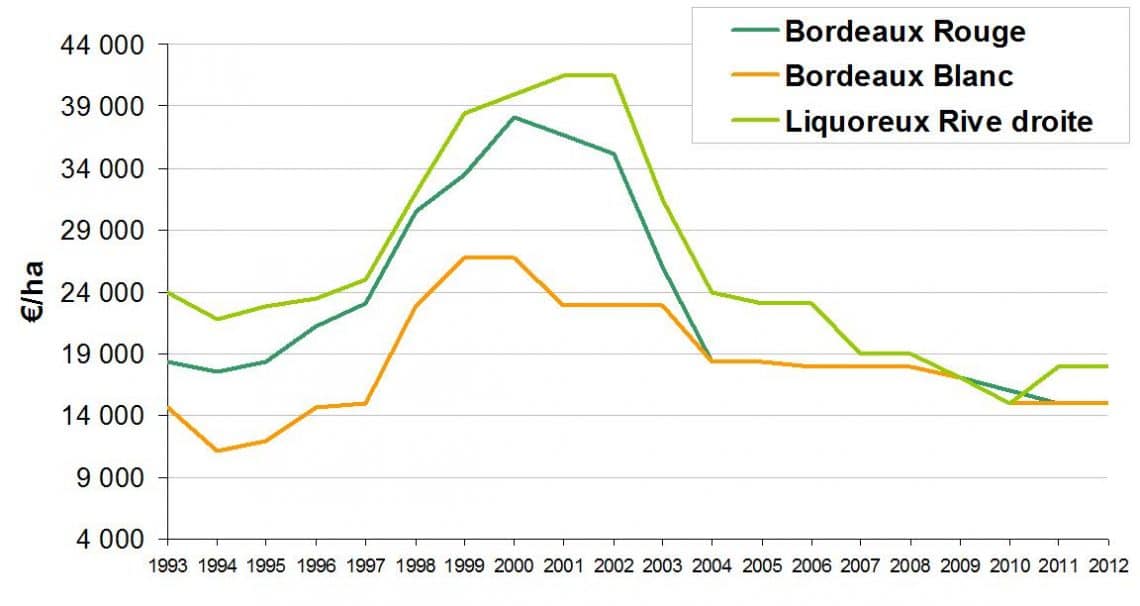
In this article, however, the nature of the price per hectare values are of less interest than the relative movement of the market over the past 15 years or so. Let’s look at Bordeaux Superieur first.
1. Bordeaux Superieur, Red, White and Sweet wine. Together with the Côtes de Bordeaux (below) this market makes up the vast majority of the Bordeaux vineyard stock, just under 70% of the +/- 120,000 hectares of the Bordeaux AOC. These markets therefore are the most significant with respect to the volume of wine sold into the global wine market each year. This is an important point since it was this volume market that was most seriously challenged by the growing “new world” wine producers. The peak for Bordeaux Red wine vineyards was well over €40,000/ha (the average of course being lower per the graph) around year the 2000. The collapse of the Bordeaux volume wine market therefore led to the downward pressure of the Bordeaux volume vineyard market which was further compounded by the financial crises of 2007/8.
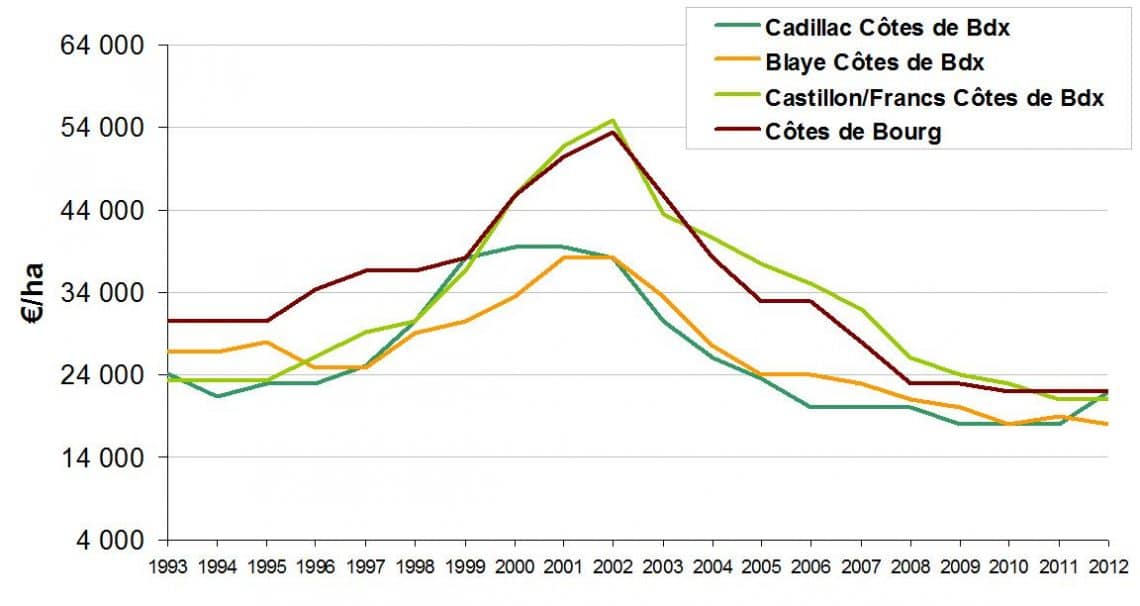
2. Côtes de Bordeaux,Castillon, Cadillac, Premières cotes, Francs, Bourg. This area is the second biggest geographical segment of the Bordeaux AOC and its wines fall within a price band that was also and is still challenged by the New World. As a result its market profile over the past 15 years follows a very similar pattern as Bordeaux Superieur (see above). Again the top achieved prices were considerably higher than the averages shown in the graph here.
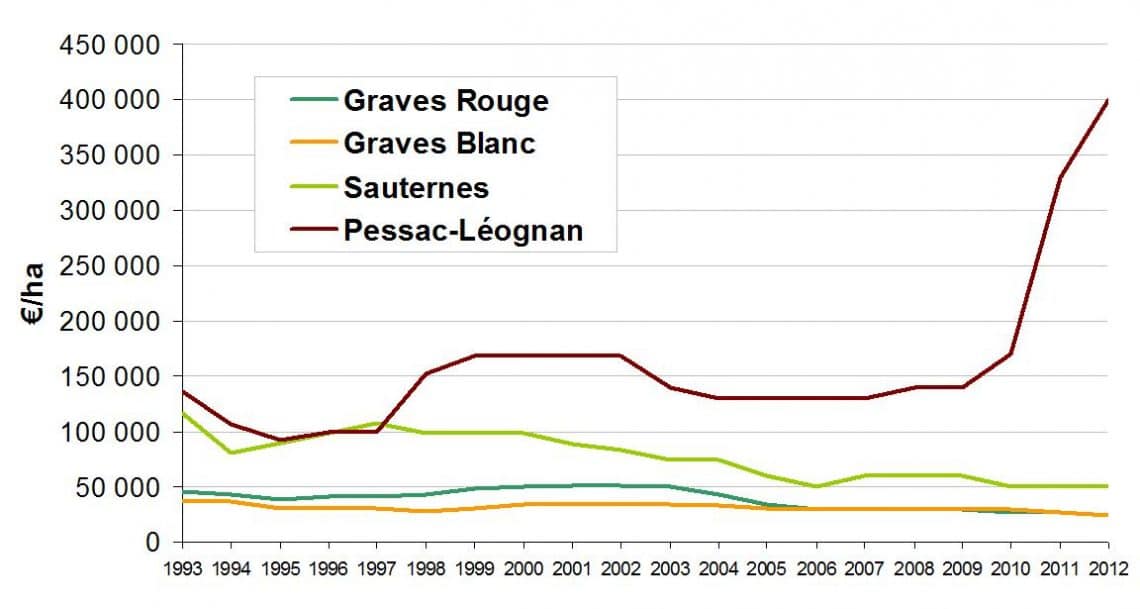
3. GravesPessac-Léognan, Sauternes. This is a small group of specialist wines. Sauternes being specialist as a result of their famous sweet wines whose brands were not affected by the global competition and overall demand and supply remained constant in both wine markets and vineyard markets. The vineyard markets stayed stable until 2010 when some exceptional sales took place in Pessac-Leognan and given the small size of this group of appellations the average was heavily influenced causing the sharp spike in prices from 2010 to 2012. Robert Wilmers owner of Chateau Haut Bailly who purchased Chateau Le Pape and Bernard Magrez who purchased Chateau Malleprat – both transactions in 2011/2012. Also in 2012 Chateau Les Carmes Haut-Brion doubled its vineyard holdings with the inclusion of vines from Chateau du Thil Comte Clary. The Cathiards of Smith Haut Lafitte bought 11.6ha while at the end of 2010 Groupe Pichet purchased the 4.7 ha Carmes Haut-Brion for €3.8m. All this is just to say that the average prices shown in the graph here are skewed by these significant sales. We are noting that Graves is seeing increasing demand along with Pessac-Léognan however, Sauternes remains stagnant.
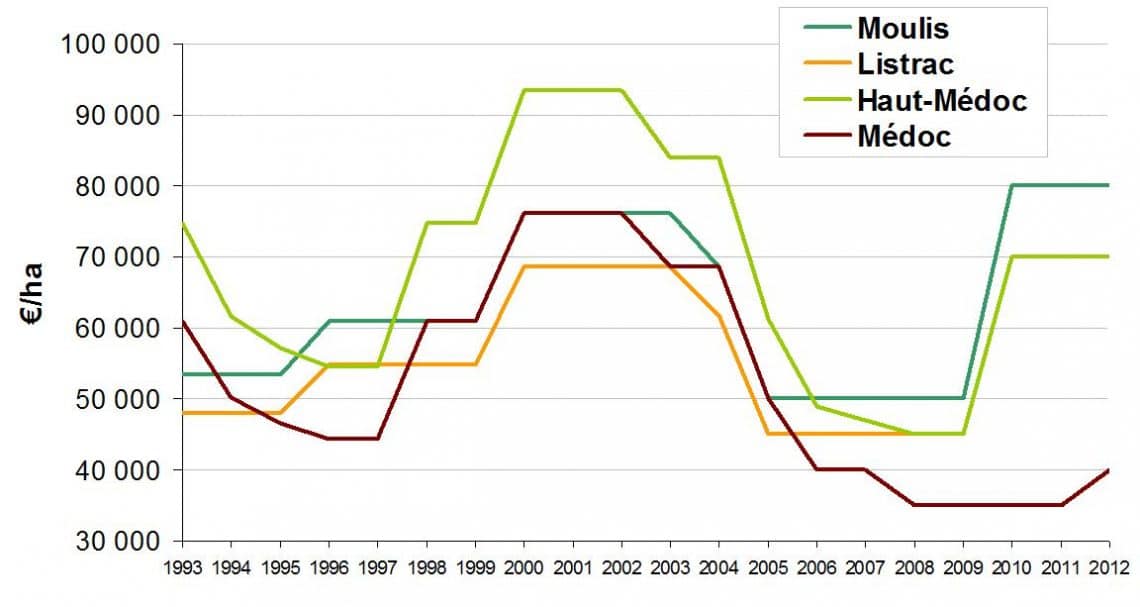
4. Haut Medoc.Haut Medoc is 4270 hectares and is the region of the Medoc that accommodates many of the less well known Medoc chateaux. Haut Medoc follows a similar peak in vineyard prices around the turn of the millennia and subsequent crash in the early years of the decade. However, in this case the price per hectare averages were less influenced by global demand for Bordeaux wine and competition from the New World producers and more to do with the reduced number of transactions that took place between 2003 and 2009. Again, in a smaller geographic area the price averages can be wildly different if two or three chateaux sell. Château Pichon Longueville Contesse de Lalande – 2nd Grand Cru : 75 hectares in Pauillac was sold in 2007 to Champgne House, Louis Roederer. Louis Roederer then decided to sell a part of this acquisition (Chateau Bernadotte) that was located in Haut Medoc in 2012. Therefore Chateau Bernadotte (38 ha) priced at over €10 million was sold to King Power group from Hong Kong accounting for the strong rise in the average.
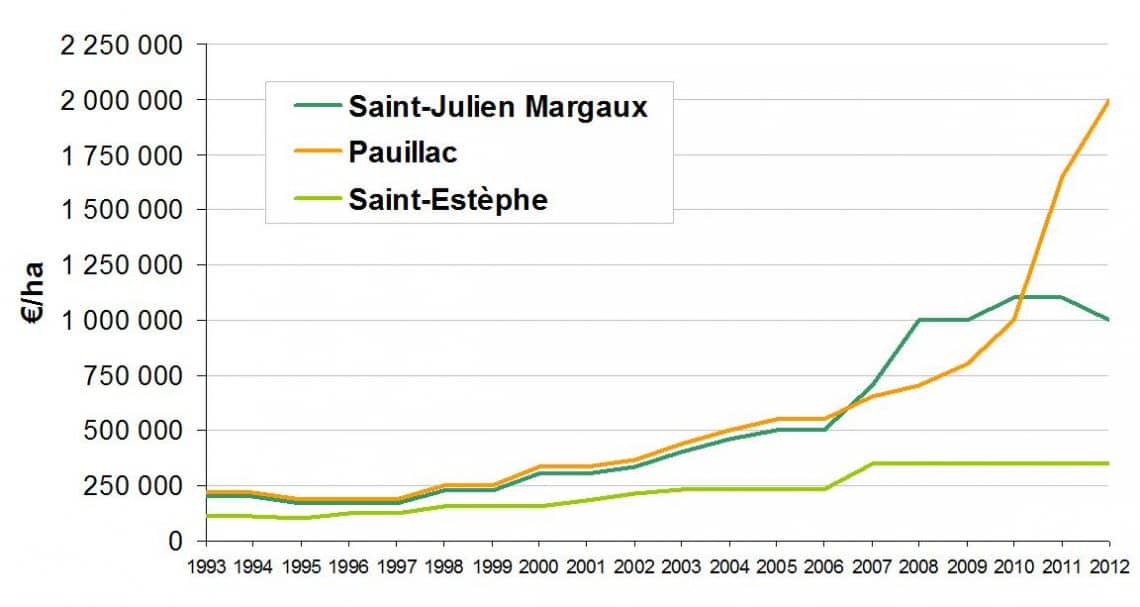
5. Saint-Estephe,Pauillac, Saint-Julien Margaux. Another smaller group of appellations by geographical area with a heavy influence from classified growths. What we see is a picture that has followed the investment grade wines. Being affiliated to Christie’s we are well aware of the astonishing growth in prices for investment grade wines, in Bordeaux, broadly represented by the classified growths. The graphs here follow the rising demand in bottles of wine as an investment asset class which after the financial crash of 2007/2008 became a part of investors’ investment portfolios. Once again the effects of very few sales have a dramatic effect on the average which for Pauillac went vertical on the graph.
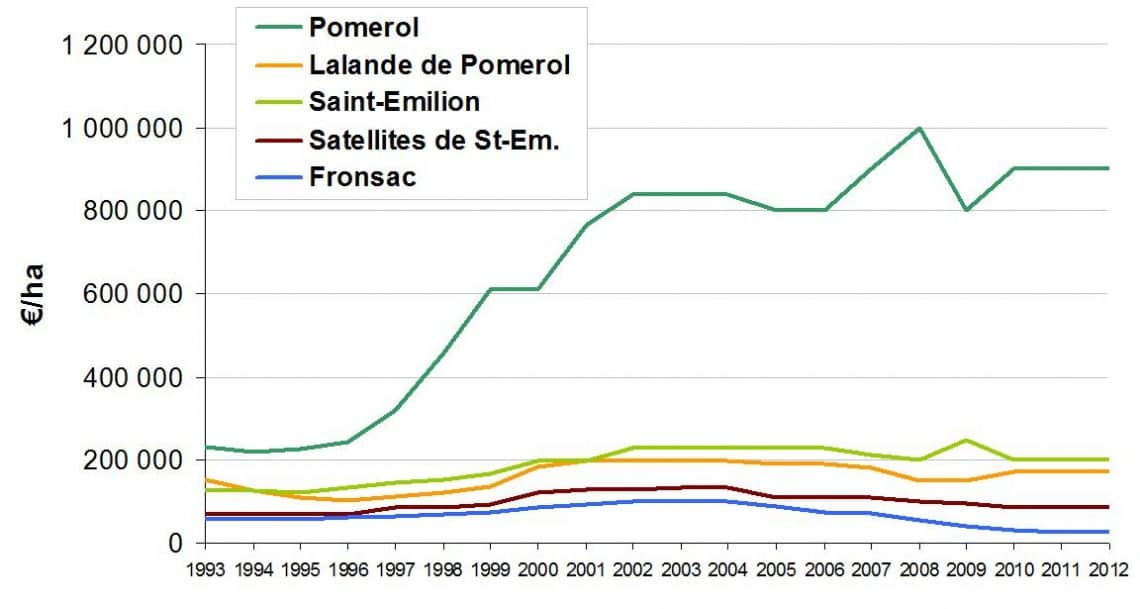
6. St Emilion, Fronsac, Pomerol and Satellites. St Emilion alone is about 5,500 hectares and together with its satellites, Pomerol and Fronsac accounts for the largest of the smaller AOC groupings that the SAFER put together. Being larger the effects of small parcels of land exchanging hands will be more significant, pulling the average price per hectare down even when a big expensive estate sells. We have observed a lot of trading activity in this sector now for 24 months and can forecast that demand now exceeds supply for both parcels and estates in the region of St Emilion. The 2013 numbers will include the sales of two classified vineyards; Chateau Montbousquet, Chateau Belfont Belcier as well as Chateau Quercy (Grand Cru) all of which will impact the average price upwards significantly.
Written by: Karin Maxwell and Michael Baynes